Haiti in Decline: Identifying and Quantifying Vegetation Loss from 2014–2021
GEOG 6110 — Remote Sensing Analysis
Introduction
Haiti has experienced extensive vegetation loss for decades, driven by fuelwood/ charcoal production, agricultural clearing, and difficulty managing land. Approximately 85% of Haitians rely on fuelwood for basic necessities, while charcoal production also represents a major source of income. These pressures have contributed to concerns over deforestation, soil degradation, and the long-term sustainability of Haiti's remaining vegetation.
This project used remotely sensed imagery to identify and quantify vegetation change in Haiti between 2014 and 2021. Three “Regions of Interest” (ROIs) were selected to represent different geographic and land-use conditions: Port-au-Prince, Gonâve Island, and the Central Plateau (Figure 1). Port-au-Prince represented a densely populated urban environment, Gonâve Island an isolated rural environment historically used for fuelwood harvesting, and the Central Plateau a heavily vegetated rural region associated with wood harvesting.
Vegetation change was evaluated using two complementary remote-sensing techniques: Normalized Difference Vegetation Index (NDVI) differencing and supervised Maximum Likelihood Classification. The objective was to identify where vegetation changes occurred and compare trends among the three study areas.
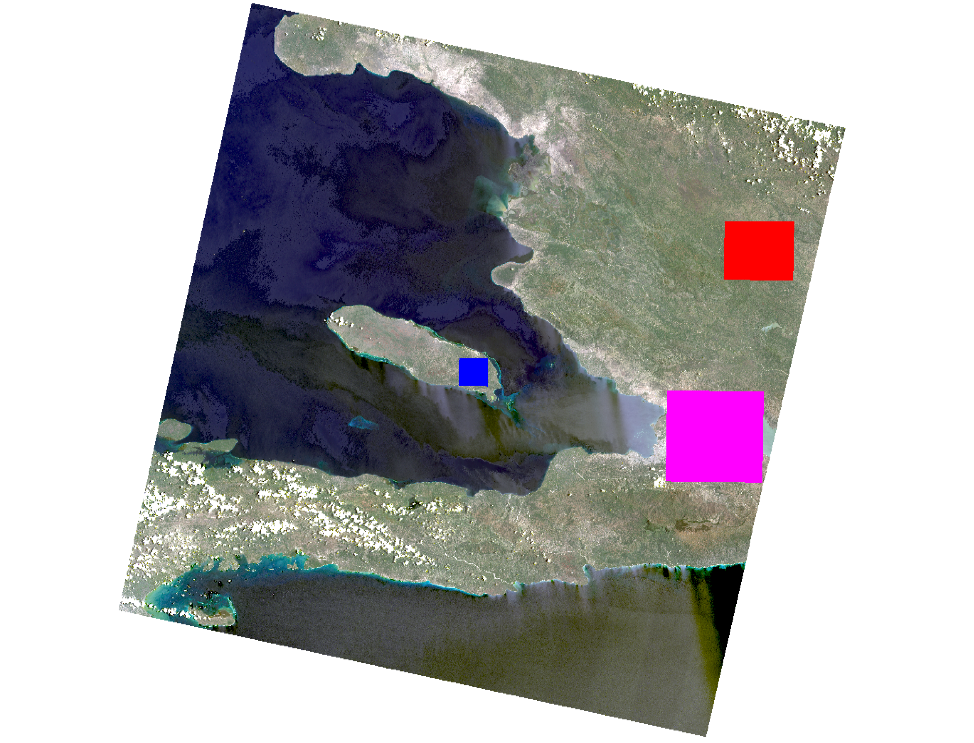
Figure 1) Study locations in Haiti, Pink = Port Au Prince, Blue = Gonâve Island, Red = Central Plateau
Methods
Landsat 8 Collection 2 Level 2 surface-reflectance imagery was obtained through USGS EarthExplorer at a spatial resolution of 30 meters. Images were restricted to the same path and row and from July and August to minimize seasonal differences in vegetation conditions. Cloud cover was initially limited to 20% or less. Persistent tropical cloud cover reduced the number of usable scenes, so the analysis focused on the three ROIs rather than the entire Landsat scene. Imagery from 2014, 2016, 2018, 2020, and 2021 was selected because these years contained little or no cloud interference within the study areas.
Image preprocessing and analysis were conducted primarily in ENVI. Landsat bands were stacked, and NDVI was calculated using the red and near-infrared bands. NDVI differencing was performed for 2014–2016, 2016–2018, 2018–2020, and 2014–2021. Mean differences were used to evaluate overall vegetation change, while standard deviations characterized spatial variability.
A second analysis used supervised Maximum Likelihood Classification to classify imagery into five land-cover categories: urban, vegetation, water, clouds, and non-productive vegetation/soil (NPV/soil). Training and reference ROIs were developed for each image, followed by accuracy assessments. ENVI's Change Detection Statistics tool was then used to quantify transitions between land-cover classes, with particular attention to changes between vegetation and NPV/soil.


Figure 2) 2014 vs 2021 Maximum Likelihood Classification per study location
Results
The results revealed more complex vegetation dynamics than originally anticipated. Rather than consistent vegetation decline across all three study areas, the NDVI and classification analyses identified both vegetation loss and recovery depending on location and time period.
Port-au-Prince showed evidence of an overall vegetation rebound between 2014 and 2021. NDVI values were higher in 2021 than in 2014, although increasing standard deviation indicated greater spatial variability. Classification results supported this trend, identifying a net increase of approximately 120,261 vegetation-class pixels. Vegetation loss was more apparent in less urbanized areas surrounding the city than within the metropolitan study area itself.
Gonâve Island also produced results opposite to the anticipated pattern of vegetation decline. Although vegetation decreased during portions of the study period, a substantial rebound occurred after 2018. Classification results showed a transition from predominantly NPV/soil toward greater vegetation coverage, with a net increase of approximately 32,079 vegetation pixels and corresponding decrease of 31,870 NPV/soil pixels between 2014 and 2021.

Figure 3) NDVI Differencing Statistics, per site, table. Negative values show NDVI growth. Positive values show NDVI decline.
The Central Plateau produced the strongest evidence of vegetation loss but also the greatest disagreement between analytical methods. NDVI showed considerable spatial variation and only a modest indication of overall decline. In contrast, Maximum Likelihood Classification identified a decrease of approximately 68,891 vegetation pixels and an increase of 69,560 NPV/soil pixels, particularly in the northwestern portion of the study area.
Classification accuracy remained high across all five analyzed years, with overall accuracy ranging from 97.11% to 99.27%. However, distinguishing spectrally similar classes, particularly urban areas and NPV/soil, remained an important source of uncertainty when interpreting land-cover change.

Figure 4) 2014 to 2021 classification changes per study site
Discussion
The analysis did not confirm the original expectation of widespread vegetation loss across Haiti. Port-au-Prince and Gonâve Island, instead showed evidence of vegetation recovery, while the Central Plateau produced mixed results depending on the analytical technique. These differences demonstrate that vegetation change in Haiti is spatially complex and cannot necessarily be characterized by a single national trend.
One possible explanation considered in the research is Haiti's changing transportation network. Road expansion may have increased access to previously isolated vegetated areas, potentially shifting harvesting pressure away from already depleted areas surrounding Port-au-Prince and reducing reliance on maritime transport from Gonâve Island. This could partially explain the recovery in these locations, although the remote-sensing analysis alone cannot establish a causal relationship.
The disagreement between NDVI and classification results in the Central Plateau also highlights an important methodological limitation. Tropical landscapes are highly dynamic, and supervised classification introduces uncertainty through training-data selection and the separation of spectrally similar land-cover classes. Consequently, results from one study area should not be extrapolated to Haiti as a whole.
Ultimately, the project demonstrates both the capabilities and limitations of multitemporal remote sensing for environmental change detection. Combining NDVI with supervised classification provided two perspectives on vegetation change and revealed patterns that would have been less apparent using either method independently. Future research could incorporate a longer temporal record, additional cloud-free imagery, field observations, and community-level information to better distinguish long-term vegetation trends from short-term fluctuations and classification uncertainty.
Skills/Tools
Remote Sensing • Landsat 8 • USGS EarthExplorer • ENVI • NDVI • Supervised Classification • Maximum Likelihood Classification • Change Detection • Image Classification • Accuracy Assessment • Multitemporal Analysis