Spatial Patterns and Drivers of Heat Waves Across the United States
GEOG 6160 — Advanced Spatial Analysis
Introduction
As global temperatures rise, heat waves are becoming more frequent, intense, persistent, and spatially extensive. These events pose significant risks to human health, infrastructure, agriculture, and natural ecosystems. In the United States, mortality has been shown to increase during heat waves, while major events have resulted in billions of dollars in economic damages. Understanding where heat waves occur and the atmospheric and land-surface conditions associated with their formation is therefore increasingly important for climate adaptation and hazard planning.
This project examined the spatial patterns and environmental drivers of summer heat waves across the contiguous United States (CONUS) from 2000–2024. Particular attention was given to the interaction between large-scale atmospheric circulation and surface-level conditions that can intensify extreme temperatures.
Heat waves were evaluated using temperature alongside several atmospheric and land-surface variables, including 500 hPa geopotential height, surface net solar radiation, dew point temperature, soil moisture, lower-atmospheric wind, and total cloud cover. Empirical Orthogonal Function (EOF) analysis was used to identify dominant spatial patterns of heat-wave variability, while Shapley variance attribution was used to quantify the relative contributions of environmental variables to those patterns.
Methods
All climate data were obtained from the ECMWF ERA5 reanalysis dataset at a spatial resolution of 0.25 degrees. The analysis included June, July, and August from 2000–2024, representing the primary heat-wave season across CONUS. Hourly observations were aggregated into daily averages, with daily maximum values used for air temperature.
Heat waves were defined as periods when daily maximum temperature exceeded the 95th-percentile threshold for at least two consecutive days and affected at least 2% of CONUS land area. This definition excluded isolated single-day temperature extremes and small localized events, focusing the analysis on spatially extensive and persistent heat waves.
Empirical Orthogonal Function (EOF) analysis was used to reduce the multidimensional dataset and identify the dominant spatial modes of heat-wave variability. Traditional EOFs were used to characterize broad regional patterns associated with atmospheric circulation, while rotated EOFs (REOFs) provided more spatially localized patterns that could better represent regional influences and land-surface feedbacks.
A Shapley variance attribution analysis was then used to estimate how strongly the selected environmental variables contributed to each EOF pattern. The resulting Shapley values represented each variable's contribution to the model's explained variance and were normalized to compare their relative importance. This allowed large-scale circulation controls to be evaluated alongside variables such as soil moisture, solar radiation, cloud cover, and atmospheric moisture.
Finally, heat-wave behavior was evaluated using two complementary metrics: the number of heat-wave events and the total number of heat-wave days. Separating these metrics allowed regional differences in event frequency to be distinguished from differences in persistence and duration.
Results
EOF analysis revealed strong regional patterns in summer heat-wave activity across CONUS. The traditional EOFs exhibited dipole patterns consistent with large-scale variations in atmospheric ridging and troughing. These patterns indicate that different regions can experience opposing heat-wave conditions under the same circulation mode. The first three traditional EOF modes accounted for approximately 65% of the spatial variability in the dataset (Figure 1).
Rotated EOFs revealed more localized patterns than their traditional counterparts. Rather than primarily representing broad atmospheric circulation, these patterns helped identify areas where land-surface feedbacks may enhance heat-wave formation in conjunction with pressure anomalies, including potential influences from soil moisture and atmospheric moisture (Figure 2).

Figure 1) Traditional Empirical Orthogonal Functions, Leading 3 modes (EOFs 1-3) explain over 65% of the variability in the dataset
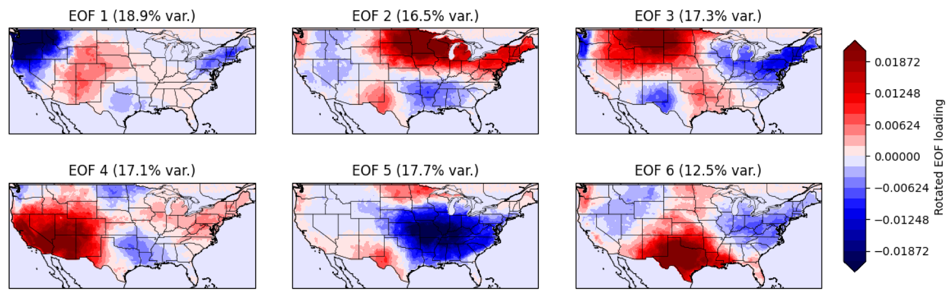
Figure 2) Rotated Empirical Orthogonal Functions, highlights more localized trends.
Shapley variance attribution further demonstrated the importance of large-scale atmospheric circulation. For example, EOF1 represented 26.3% of the spatial variability in the heat-wave dataset, while the selected environmental variables explained approximately 69% of the variability associated with its principal component. Of that explained variability, 75.1% was attributed to geopotential height. Soil moisture, surface net solar radiation, and total cloud cover also emerged as important contributors across the analyzed patterns (Figure 3).
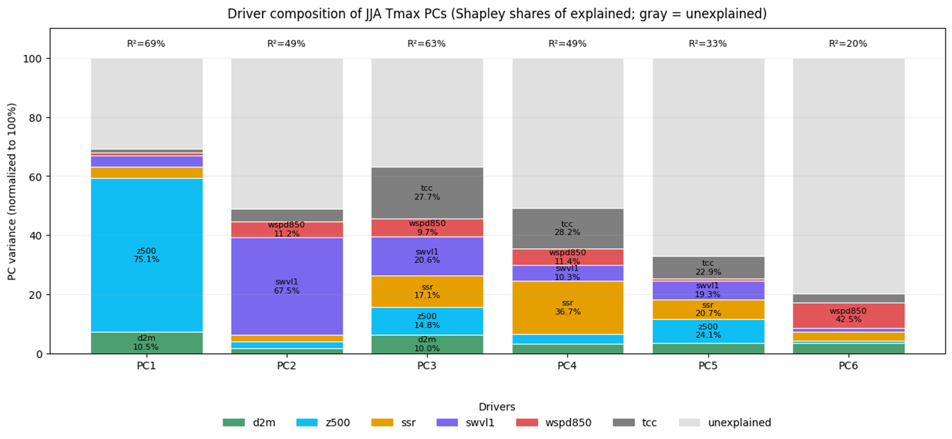
Figure 3) Shapley decomposition of environmental drivers contributing to the variance of each EOF principal component. Colored bars represent the percentage share of explained variance attributed to each driver.
Clear geographic differences were also observed in heat-wave frequency and persistence. Inland areas, particularly the Great Basin and portions of Texas, accumulated relatively high numbers of heat-wave days, while coastal locations generally experienced shorter-duration events (Figure 4). The Northwest displayed comparatively high heat-wave event frequency but lower persistence, indicating that frequent events do not necessarily correspond to the longest-lasting heat waves. A similar distinction was visible around the Great Lakes. (Figure 5). Temporal trends also indicated that heat-wave duration increased more consistently than event frequency between 2000 and 2024.
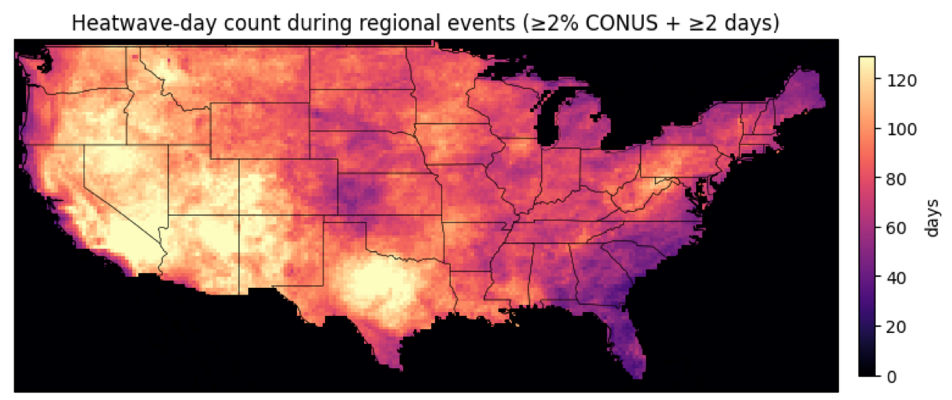
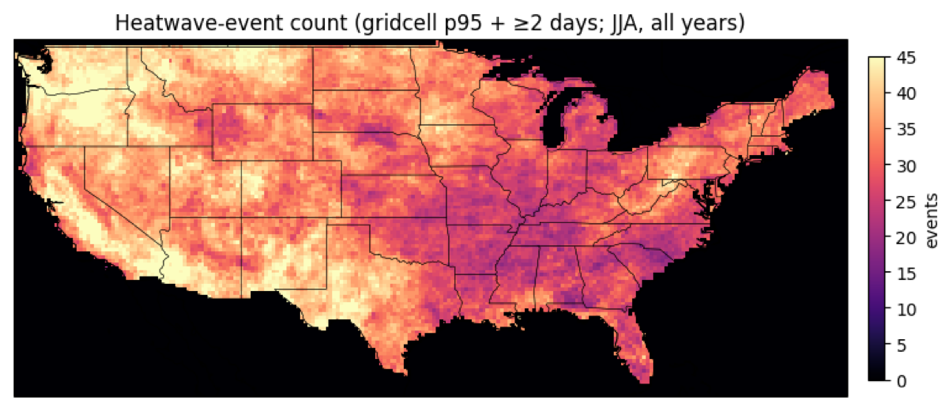
Figure 4) The number of heat wave days from 2000-2024 experienced by each cell.
Figure 5) The number of heat wave events from 2000-2024 experienced by each cell.
Discussion
The results suggest that heat waves across the United States are shaped by the interaction of large-scale atmospheric circulation and regional land-surface conditions. Traditional EOF patterns were strongly associated with atmospheric ridging and elevated geopotential heights, conditions that promote high pressure, reduced cloud formation, increased solar heating, and persistent surface warming.
The Shapley analysis reinforced this relationship by identifying geopotential height as a dominant contributor to heat-wave variability, while soil moisture and cloud cover also emerged as important factors. Together, the EOF and attribution analyses indicate that broad atmospheric circulation establishes favorable conditions for extreme heat, while surface-level feedbacks can further amplify those conditions regionally.
The distinction between heat-wave frequency and duration is also important for understanding regional risk. Some areas experienced frequent but relatively short events, while inland regions were more likely to experience prolonged heat. This distinction has practical implications because a location experiencing fewer but longer-lasting events may face different infrastructure, public-health, and emergency-management challenges than a location experiencing frequent short-duration heat waves (Figure 6).
Although the 25-year dataset captured meaningful spatial and temporal patterns, it represents a relatively short period for climatological analysis. Future research could extend the temporal record and integrate the results with demographic and socioeconomic vulnerability data to identify populations facing the greatest combined exposure and sensitivity to extreme heat.

Figure 6) The number of heat wave events and days per year from 2000-2024.
Skills/Tools
Climate Data Analysis • ERA5 Reanalysis • Spatial Analysis • Empirical Orthogonal Functions (EOF) • Rotated EOFs • Principal Component Analysis • Shapley Variance Attribution • Machine Learning • Multivariate Analysis • Spatiotemporal Analysis • Data Visualization