Mapping Extreme Heat Vulnerability Among Unsheltered Populations in Los Angeles County
GEOG 6960 — Geographic Problems
Introduction
Extreme heat is an increasing public health concern, particularly for people experiencing homelessness. Unsheltered individuals face continuous exposure to outdoor conditions while often having limited access to air conditioning, hydration, transportation, and healthcare. These risks can be intensified in urban environments by heat-retaining impervious surfaces and limited vegetation.
This project used GIS to examine the geographic inequities of extreme heat exposure among unsheltered populations in Los Angeles County. The analysis focused on where unsheltered homelessness overlaps with limited tree canopy, poor access to cooling centers, high levels of impervious surface, and projected future temperatures. The objective was to identify communities where heat-mitigation measures such as additional tree canopy, cooling infrastructure, or other interventions may have the greatest impact.
Los Angeles County provided a valuable study area because of its large homeless population and considerable geographic variation. Coastal, mountainous, urban, and inland desert environments create substantial differences in heat exposure and access to cooling resources across the county (Figure 1).
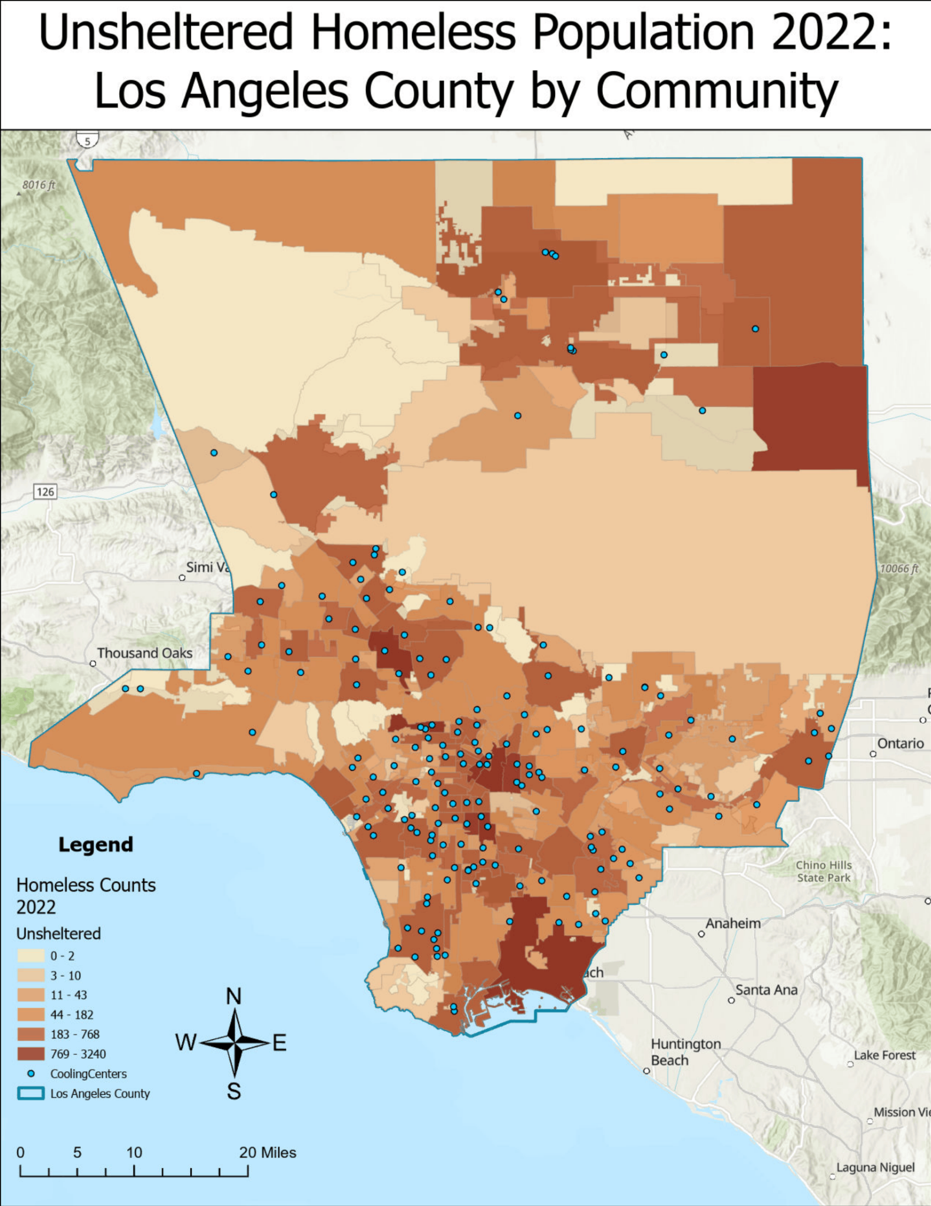
Figure 1) Unsheltered Homelessness in Los Angeles County
Methods
The analysis incorporated multiple spatial datasets representing both heat exposure and adaptive capacity. Unsheltered homelessness was represented using 2022 Los Angeles Homeless Services Authority point-in-time counts. Environmental variables included USGS tree canopy coverage and NLCD fractional impervious surface data. Cooling center locations were obtained from Los Angeles County, while projected average temperatures for 2035–2064 were obtained from Cal-Adapt.
All datasets were projected into NAD 1983 State Plane California V and clipped to Los Angeles County. Cooling center accessibility was modeled in ArcGIS Pro using an origin-destination cost matrix, which calculated walking travel time from population-weighted census tract centroids to the nearest cooling center. Walking was selected to account for potential transportation limitations among unsheltered populations. Minimum travel times were then interpolated using Inverse Distance Weighting (IDW) to create a continuous cooling-accessibility surface (Figure 2).
Environmental and accessibility variables were aggregated to community boundaries using zonal statistics. Bivariate mapping was then used to identify areas where high levels of unsheltered homelessness coincided with either long cooling-center travel times or low tree canopy coverage.
Three normalized heat-risk indices were also developed. The first represented environmental and infrastructure conditions using cooling access, impervious surface, and inverted tree canopy coverage. The second incorporated unsheltered homelessness to represent population vulnerability. The final index incorporated all variables, including projected future temperatures, to identify areas where existing heat vulnerability may intensify under future conditions.

Figure 2) Cooling Center Accessibility Surface in LA County, created with OD Cost Matrix and IDW interpolation
Results
The analysis revealed considerable geographic variation in homelessness, cooling-center accessibility, and tree canopy throughout Los Angeles County. Unsheltered homelessness was concentrated around downtown Los Angeles, Long Beach, and the Palmdale/Lancaster region. Cooling-center accessibility was more limited in portions of Long Beach, Santa Monica, and the northern county, while tree canopy was concentrated primarily around mountainous areas and was comparatively limited in downtown Los Angeles and the Palmdale/Lancaster region (Figure 2).
Bivariate analysis revealed that different communities experience different dimensions of heat vulnerability. High unsheltered populations combined with long cooling-center travel times were particularly evident around Long Beach, Santa Clarita, and Palmdale/Lancaster. Downtown Los Angeles, despite its large unsheltered population, showed comparatively strong cooling-center accessibility (Figure 3).
A different pattern emerged when homelessness was compared with tree canopy coverage. Downtown Los Angeles and the Palmdale/Lancaster region contained concentrations of high unsheltered homelessness combined with limited tree canopy, demonstrating that strong access to cooling infrastructure does not necessarily correspond with favorable outdoor environmental conditions (Figure 4).
The composite indices further demonstrated how multiple variables interact to produce heat vulnerability. Adding unsheltered homelessness shifted modeled risk toward communities containing vulnerable populations, while the final index incorporated projected temperatures and impervious surfaces to highlight locations where existing vulnerabilities could intensify under future warming conditions.


Figure 3) Homeless Risk Index, Index composed of normalized travel time and inverted normalized tree canopy coverage
Figure 4) Homeless Risk Index Incorporating Homelessness, Index composed of normalized travel time, inverted normalized tree canopy coverage, and normalized unsheltered homeless
Discussion
The results demonstrate that heat vulnerability is not evenly distributed across Los Angeles County and cannot be explained by a single variable. Instead, vulnerability develops through the interaction of environmental exposure, access to cooling infrastructure, and the spatial distribution of vulnerable populations.
Downtown Los Angeles illustrates this complexity particularly well. The area contains a substantial unsheltered population but also has relatively strong cooling-center accessibility. At the same time, limited tree canopy and highly urbanized conditions may increase outdoor heat exposure. This suggests that access to cooling infrastructure and environmental conditions should be considered together when evaluating heat vulnerability.
Long Beach emerged as another notable area of vulnerability, combining elevated unsheltered homelessness with relatively long cooling-center travel times and limited tree canopy. The Palmdale/Lancaster and Antelope Valley region similarly showed limited cooling-center accessibility and tree canopy alongside concentrations of unsheltered homelessness, placing vulnerable populations within an already hot inland environment.
Moving from individual variables to bivariate maps and composite indices provided a more complete representation of these relationships. Rather than identifying vulnerability solely from population or temperature, the GIS framework identifies locations where multiple risk factors overlap, allowing potential heat-mitigation efforts to be geographically targeted.
The methodology is also transferable beyond this specific analysis. The same framework could be adapted to other communities or populations by combining spatial measures of environmental exposure, infrastructure accessibility, and population vulnerability.
Skills/Tools
ArcGIS Pro • Network Analysis • Origin-Destination Cost Matrix • IDW Interpolation • Raster Analysis • Zonal Statistics • Bivariate Mapping • Spatial Data Normalization • Composite Risk Indices • Climate Data • Environmental Justice Analysis • Cartography